
A lot of statistical analysis seems to view baseball, or players, in a one dimensional way. On the whole it is better to view it as a number of intertwined variable that exist together, effecting each other. Pitching and offense are a good example. It can be shown that on a league wide level, there is a definite positive correlation between the two. In a year of strong offensive performance statistics, the pitching performance statistics will be weaker.
Below are fifty years of data, 1994 through 2013, comparing OPS to ERA and WHIP for the NL. The r value for OPS/WHIP is just over .9, for OPS/ERA it is about .96. All this make sense in that OPS correlates closely to runs scored, and ERA and WHIP correlate to runs allowed, with ERA being very closely related.
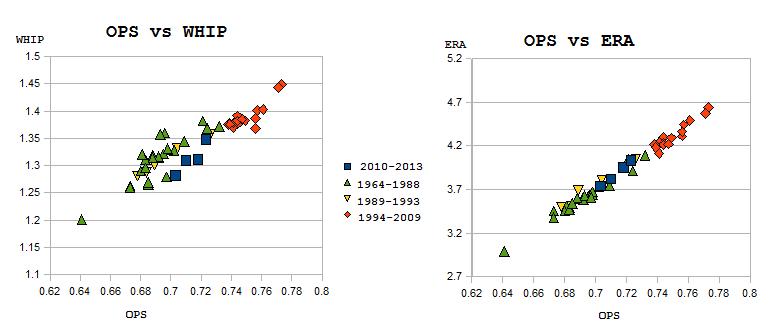
What I find interesting is that in all the years from 1964 through 1993 the league average OPS never was above .730, league average ERA was never above 4.09 and WHIP was 1.37 or less, with the exception of 1.38 in 1970. Then from 1994 through 2009, the NL average OPS was always over .740, the league average was 4.11 or over, and the league average WHIP was 1.37 or higher. In 2010 everything reverted to the earlier range.
People can draw their own conclusions. But to me, the years from 1994 through 2009 stand out as a time when steroids slanted the game heavily toward the offense.


Objective analysis of all things baseball at Beyond The Box Score