Back in Novemeber, I introduced what we believe to be the most complete list of baseball players who have undergone the UCL reconstruction procedure that has come to be commonly known as Tommy John surgery.
With a relatively large sample of major league pitchers on the list, there is ample opportunity for many different studies relating to the surgery. To date I have been investigating characteristics of pitchers solely in the seasons just prior to Tommy John surgery. I looked at the frequency with which pitchers were throwing each type of pitch, as well as the velocities reached with each pitch type, and compared these to the league average pitcher of the same age and pitching role cohort. While the differences were small in magnitude from the league average pitcher, in each case the findings appeared to agree with other more scientific research on these types of injuries.
A few interested readers suggested looking at pitch movement as another characteristic of pitching that we can measure, thanks to Pitch F/X. Today we will discuss this investigation.
Method
I should first note that in the original two investigations, I relied on Baseball Info Solutions pitch data, as it has been available since 2002 and by selecting it I was able to increase my sample size over a longer stretch of seasons. The Pitch F/X data that includes horizontal and vertical pitch movement values has been available only since 2007. Thus in performing the pitch movement study discussed herein, the sample size of pitchers who underwent Tommy John surgery is smaller - a little over half of the original sample that covered twice the number of years.
In the cases of pitch frequency and velocity, it seemed clear to me that when performing a comparison of Tommy John pitchers versus the league average pitcher, I would need to control for the age of the pitcher as well as the pitching role (i.e. starter or reliever). Both of these characteristics of a pitcher can certainly impact the types of pitches being thrown as well as the velocity of these pitches.
In the case of pitch movement, it is less clear to me that these controls are necessary. The main reason I could see these affecting average pitch movement is if there is a correlation between velocity and pitch movement, and there is some evidence that this may be the case. I decided to calculate the league averages anyway, which are shown in the charts below.
The one characteristic of the pitcher that will certainly play a role in pitch movement is the handedness of the pitcher. Rather than divide my already decreased sample of Tommy John pitchers by handedness, which would have left me with just a handful of left-handed pitchers, I decided to look at the magnitude of the horizontal movement only, rather than magnitude and direction. The idea here is that a right-handed pitcher should have a pitch type break in one horizontal direction, while a left-handed pitcher should have that same pitch type break in the opposite horizontal direction. I am more interested in any visible trend that may exist in the amount of break on these pitches. Clearly I will lose some information by doing so, but this would mainly be on the cutter as it is the one pitch that is fairly equally balanced between horizontal break to each side of the plate. Later on in the results I will include a map that visualizes the typical movement for each pitch type. As for the vertical break, I left these values untouched, as see no reason why both righties and lefties would not typically see the same amount and direction of vertical movement in their pitches.


Data: Pitch F/X via Fangraphs, 2007-2012
From the graphs, there do not appear to be a lot of systematic rises or falls in movement of a particular pitch type as pitchers age. The vertical movement achieved by relievers with their sliders is an example of a pitch with an apparent pattern.
As in the previous studies, I will examine the deltas between the pitch movement of the average pitcher headed toward Tommy John surgery and the league-average pitcher of the same age and pitching role. I will calculate the deltas for each major Pitch F/X pitch type, and repeat for two years prior to the surgery, the year before the surgery, and the year of the Tommy John surgery.
Results
Here are the results of this comparison process:
| Years Prior | FA H | FA V | FT H | FT V | SL H | SL V | CT H | CT V | CB H | CB V | CH H | CH V | SF H | SF V | Sample Size |
|---|---|---|---|---|---|---|---|---|---|---|---|---|---|---|---|
| 2 years prior | 0.51 | -0.01 | 0.35 | -0.62 | -0.45 | 0.08 | 0.00 | 0.44 | -0.47 | 0.18 | 0.23 | -0.49 | 0.20 | 1.21 | 57 |
| 1 year prior | 0.53 | -0.37 | -0.06 | 0.09 | -0.12 | -0.16 | 0.19 | 0.16 | -0.49 | 0.40 | -0.05 | -0.43 | 0.08 | -0.26 | 81 |
| Year of TJS | -0.30 | -0.17 | -0.01 | 0.12 | -0.10 | -0.19 | 0.03 | 0.33 | 0.00 | 0.38 | -0.26 | -0.28 | -0.39 | -0.74 | 69 |
There are a lot of numbers in that table, so it may take a minute to take it all in. If you remember the previous two studies, the first thing you might notice is that there are more columns in this table than there were before. That is partly due to their being two columns per pitch type for horizontal and vertical break, but also because Pitch F/X classifies pitches into more granular bins, breaking up what was the generic fastball in the BIS data into both four-seam (FA) and two-seam (FT) variants.
The next observation is that like in the pitch frequency and pitch velocity studies, the deltas are all small. In this case, nearly every calculated delta is less than one inch of movement. It is not surprising, as if there were gross changes this likely would have been uncovered long before now. There are certainly factors that could be interfering or causing such differences aside from a pending injury. Some of these include Pitch F/X pitch type classification adjustments over the years, the fact that each stadium will have slightly different setups that can inject systematic offsets in all readings, and purely random noise in the data.
If we take the numbers at face value though, can we detect any hints of patterns? In order to do so, it can help to visualize the typical type of movement that can be expected for each of these pitch types on a gross level. Here is a handy representation from an article by Pitch F/X expert Mike Fast, showing expected movement ranges for a right-handed pitcher from the catcher's perspective (with the "Breaks In" and "Breaks Away" suggesting a right-handed hitter at the plate).
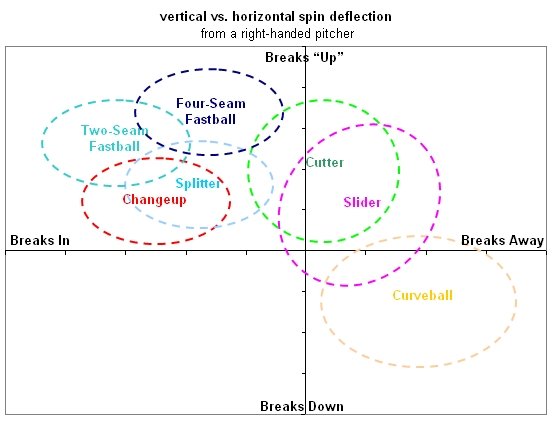
Consider the four pitch types in this image that are shown as clearly being on the "Brakes In" side of the graph on the left. If we look at the horizontal movement for each of these pitch types in the table of deltas, we see the same trend in each one. Namely, pitchers headed toward Tommy John surgery on average recorded higher than average horizontal movement on these pitches two years prior to requiring surgery, but by the season of their surgery recorded lower than average horizontal movement. While the differences are small again as in the previous studies, this is a worthwhile note.
We can then turn our attention to the three pitches in the image shown primarily in the "Breaks Away" side of the graph on the right. If we look at the horizontal movement for each of these pitch types in the differences table, we see another trend. In this case, pitchers on a path to Tommy John surgery demonstrated less than or equal to the average movement in their cohort two years prior to the surgery, but relatively increased this movement by the season of their surgery.
As a summary for horizontal movement, it seems that the average Tommy John pitcher saw every one of his pitch types break more toward the side of the graph closest to the opposite-handed hitter as his surgery approached. The one possible exception is the cutter, as with the loss of the direction of horizontal break, the increased movement could have been in the opposite direction. I'd like to reiterate that these differences are small, but I'm surprised that I can make such a sweeping statement about the results with respect to horizontal movement.
If we turn our attention to vertical movement, I should quickly explain the "Breaks Up" terminology. In the Pitch F/X frame of reference, pitch movements are calculated as compared to a theoretical pitch with no spin. Most pitches, aside from the curveball, are thrown with varying amounts of backspin. The backspin applied on the ball makes the ball fall less quickly than had the ball been thrown with no spin at all, hence the positive "Breaks Up" vertical movement values. The curveball is thrown with some amount of topspin, causing the ball to drop faster than had it been thrown with no spin whatsoever, leading to the negative "Breaks Down" vertical movement measurements.
From the table, we can see that the two-seam fastball, the curveball and the changeup are all pitches that tend to move slightly "up" relative to the league average pitcher as the Tommy John surgery approaches. This could be a coincidence, but these are the three pitches where we may expect the most horizontal break per the image.
The remaining four pitches all show more break down relative to the league average pitcher as the Tommy John surgery season nears. As the complement to the observation above, these are the four pitch types where on average we could expect the least amount of horizontal movement.
To understand a little bit about the effect that additional or reduced pitch movement can have on results, we can refer to Dave Allen's wonderful set of articles at Baseball Analysts. He shows how four-seam fastballs are most successful with significant vertical "rise", in particular for same-handed hitters. Two-seamers are also best against same-handed hitters, but alternatively are most effective when thrown with a lot of vertical "sink". Cutters that break to the catcher's right are best, and changeups with significant vertical movement are best.
In his curveball discussion, he gives a good visualization of the change in run value versus movement in a series of graphs. From these graphs we can see some areas where the slope is quite steep, suggesting that a delta of an inch of movement can actually make a noticeable different in pitch results.
Given Allen's findings, we can see that pitchers approaching their Tommy John surgery tend to see their fastball movement wane in the wrong direction for success. It is possible that the loss of velocity observed in the previous study is related to the loss of four-seam fastball "rise", as we saw earlier a reported link between velocity and vertical movement.
Alas, I'm left at this point without knowing of any particular related research into this type of question that could question or provide more support for these findings. I will hope again that someone in the biomechanics research field or otherwise might be able to shed some light on these small differences in relation to any of their own results from other studies or empirical observations.
As always please leave your comments and ideas below or you can contact me on Twitter at @MLBPlayerAnalys. <a href="https://twitter.com/MLBPlayerAnalys" class="twitter-follow-button" data-show-count="false">Follow @MLBPlayerAnalys</a>
<script>!function(d,s,id){var js,fjs=d.getElementsByTagName(s)[0];if(!d.getElementById(id)){js=d.createElement(s);js.id=id;js.src="//platform.twitter.com/widgets.js";fjs.parentNode.insertBefore(js,fjs);}}(document,"script","twitter-wjs");</script>
Credit and thanks to Fangraphs and Fastballs for data upon which this analysis was based.
Loading comments...