
In the past four years, there have been four instances where you could have fairly questioned if Greg Holland was reaching the end of his short, but impressive career. The first time came in September of 2015, when a Tommy John surgery sidelined him for over a year, eventually leading to his exit from the Royals organization.
After sitting out a year, he caught back on with an incentives-based deal with the Rockies, signaling that the expectations for him were low. It didn’t take long for him to secure the closer’s role though, and he eventually saved 41 games in a terrific comeback season.
Holland cashed in a with a one-year, $14 million deal with the Cardinals just in time for the 2018 season. But with no Spring Training and a shortened preparation time, things started out bleak for the then-32-year-old reliever. The struggles ended up never wavering, as he went on to post a 7.92 ERA and 4.56 FIP in 25 innings with the Cardinals, leading to his eventual removal from the 40-man roster.
The Nationals took a non-risk chance on Holland right after that, though. His performance between the two teams that season looked night and day. Holland pitched to a 0.84 ERA and 2.97 FIP in his final 24 games. In what looked like his final chance at a role in a major league bullpen, he had secured another one, signing a one-year, $3.5 million deal with the Diamondbacks.
Things looked bleak for Holland once again though, almost seeming like a pattern. His reports from Spring Training left much to be desired.
Greg Holland has a 12.27 ERA in four Cactus League appearances -- that doesn't include backfields games in which he appeared -- and averaged 90 mph on his fastball (at least at parks where Trackman was installed.)
— Zach Buchanan (@ZHBuchanan) March 24, 2025
Nonetheless, Holland with his past experience secured the Diamondbacks closer’s role to start the season. Once again, the expectations were mediated. But now roughly one month into the 2019 season, it looks they were undershot. Thus far, Holland has looked almost as good as ever. He has 14 strikeouts to four walks in his first nine appearances. He has yet to allow an earned run, making him five-for-five on save opportunities.
His 0.5 fWAR ranks in the top tenth of qualified relievers and it already surpasses his 2018 mark. At his current pace for the month of April, he’s set to have the second month of his career where he hasn’t allowed an earned run (minimum nine innings). He’s on pace to post the lowest wOBA against in a month out of his whole career and by FIP and strikeout-rate standards, he’s had only three and five better months, respectively.
Lowest monthly wOBA against in Greg Holland’s career
| Season | Month | Team | IP | wOBA |
|---|---|---|---|---|
| Season | Month | Team | IP | wOBA |
| 2019 | Mar/Apr | ARI | 9.0 | 0.137 |
| 2014 | Jul | KCR | 9.0 | 0.148 |
| 2013 | Aug | KCR | 11.0 | 0.153 |
| 2017 | Sept/Oct | COL | 9.2 | 0.172 |
| 2018 | Aug | WSN | 9.2 | 0.180 |
| 2011 | Sept/Oct | KCR | 9.0 | 0.184 |
| 2013 | Sept/Oct | KCR | 15.0 | 0.199 |
| 2013 | Jun | KCR | 13.0 | 0.211 |
| 2012 | Aug | KCR | 14.1 | 0.212 |
| 2017 | Mar/Apr | COL | 12.0 | 0.216 |
Since his release from the Cardinals, it would not be a stretch to say that Holland has been one of the best relievers in all of baseball. The shift in his performance split into two parts across the past year has been nothing short of remarkable.
From the beginning of the 2018 season to the date that he was DFA’d (July 27th), here were Holland’s ranks among 233 relievers with at least 20 innings in that time.
- ERA: 228th
- FIP: 188th
- xFIP: 228th
- K%: 206th
- BB%: 228th
- K-BB%: 227th
- Hard%: 121st
From July 28th to present day, here are his ranks among 241 relievers with at least 15 innings in that time.
- ERA: 8th
- FIP: 57th
- xFIP: 74th
- K%: 40th
- BB%: 211th
- K-BB%: 81st
- Hard%: 48th
And the brings up a great question. What exactly has changed for Holland?
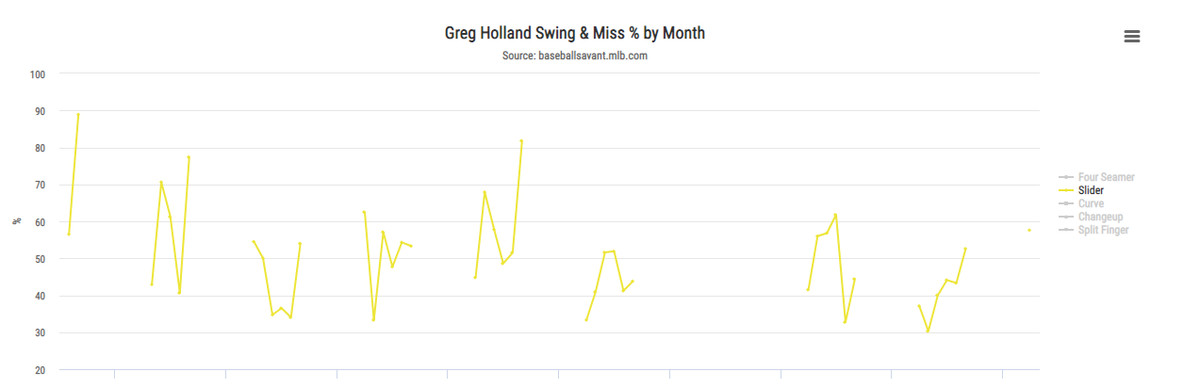
To start off, his pitch usage is the same and there’s no drastic change in velocity. The first thing that caught my eye was the results on his signature slider. The performance on it dipped during his time with the Cardinals, but since then, it’s returned to its elite level.
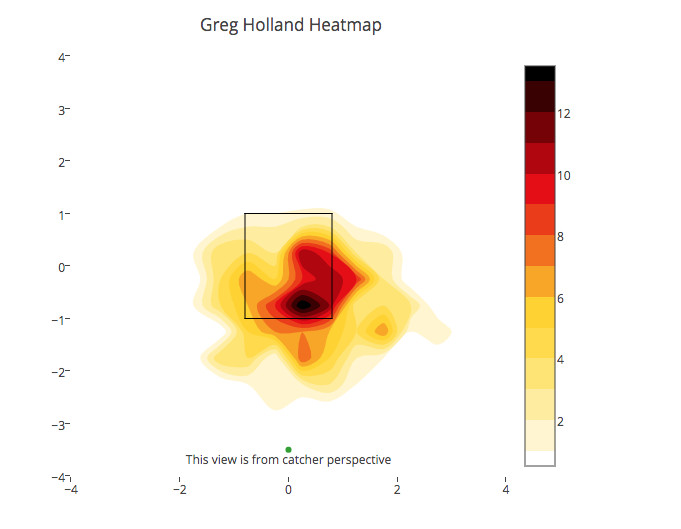
A change in location could be the culprit here. Looking at average vertical locations for sliders in those two time frames that were used above, there has been a clear adjustment for Holland. During his time with the Cardinals, he ranked in the bottom 35 percent of baseball in average horizontal slider location, meaning he was throwing them away from hitters at a higher rate than average.
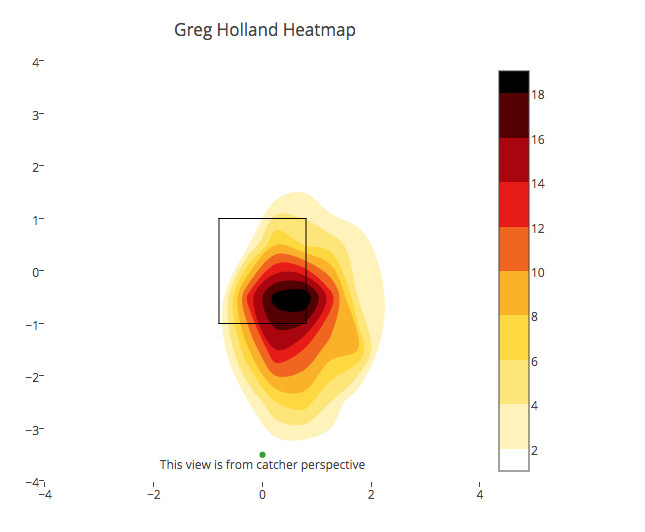
In his time with the Nationals and Diamondbacks, he’s moved to the top 35 percent, throwing them inside. This has caused hitters to swing at his slider at a higher rate, along with whiffing more, perhaps playing a major role in his strikeout-increase and walk-decrease.
To visually represent this, here’s a pitch heatmap of his sliders thrown in a Cardinals uniform.
And then in a Nationals and Diamondbacks uniform.
If history is consistent with Greg Holland and most aging relievers, this run of good performance will likely come to an end in the near future. But for now, he has played decent role in the Diamondbacks surprisingly good start. He’s exceeding expectations for now but the question is ‘how long it can last’.
Patrick Brennan loves to research pitchers and minor leaguers with data. You can find additional work of his at Royals Review and Royals Farm Report. You can also find him on Twitter @paintingcorner.
Loading comments...