Read part one of this article, “Kris Bryant: an all-time great”
Id is a great Scrabble word that is rarely not challenged. “You can’t use abbreviations!” an opponent will bark, thinking you’ve played the short hand for identification. In this instance, you can calmly recite the definition for id: “the part of the mind in which innate instinctive impulses and primary processes are manifest.” If you want to fill the time it takes them to look up the definition you just delivered with more knowledge about the word, you can refer to the narrative tool that it spawned; the shoulder angel/shoulder devil plot device.
Earlier today, I played a baseball loving, optimistic cherub, telling you how Kris Bryant’s strikeout rate improvement is a great omen. This is the point where the shoulder devil appears, perhaps wielding a baseball bat with pitchfork prongs, and tells you about the facets of Bryant’s game that remain vulnerable and could impede his value.
The Opposite Field
There are plenty of hitters who have recently had memorable campaigns while focusing on a more pull-heavy approach. It’s how Jose Bautista revived his career; it’s how Daniel Murphy and Matt Carpenter have become power hitters; and of course, there’s the poster boy of pull-hitting for power, Brian Dozier. Bryant came into the league with a 75 raw power grade with room for projection (future 80 out of possible 80 raw power grade) — simply put, his tools were and are different from the players listed above. Bryant showed fine opposite field power in 2015, hitting 4 HR between 25 deg and 45 deg (0 degrees being CF and 45 degrees being the RF line), but in 2016 the most extreme “opposite field” home run he hit was popped just 14 degrees to the right of dead center. Take a look for yourself.
This contributed to the dramatic collapse in his production when going the other way. As an opposite-field hitter in 2015, he was an above-average producer, tallying a 109 wRC+. Out of 158 hitters who sent at least 85 balls to the opposite field, he ranked 72nd. In 2016, using the same parameters, he was dead last among 148 hitters, clocking in at -0 wRC+ (literally, -0.20363).
There is only a moderate year-to-year correlation in opposite-field production (.506), so it could easily be nothing but a blip — except that he made a concerted effort to stray away from hitting the ball to right field. He had the 12th-largest increase in Pull rate and the 11th-largest decrease in Oppo rate among qualified hitters, and his Pull rate was a full standard deviation above the mean while his Oppo rate was a full standard deviation below the mean. There were nine other hitters in baseball who shared that particular distinction last year, and their average age was a shade above 33.
Pulling the ball for more power has been referred to as an old hitter’s trick, something hitters do to stave off their declining raw power; Bryant still has his raw power and is the youngest player in the group by five years. Perhaps there’s something we don’t yet understand about this approach, but when you consider which players have consistently been the best hitters in baseball over the past few seasons — Trout, Votto, Cabrera, Goldschmidt — you see a more evenly distributed batted ball approach as it concerns directional hitting. There’s a point to be made about playing to your strengths, but minimizing a portion of the field the defense needs to worry about seems counter-intuitive to sustainable production.
On the other hand, if this trend continues, it may just allow Bryant to eclipse 40 home runs every year for the next decade, and the decline in production he would likely experience in BABIP and batting average would be offset by obscene power.
O-Swing%
ZSwing% indicates the percentage of pitches in the zone a hitter swings at and OSwing% measures the percentage of pitches at which a player offers outside the zone. A rudimentary way of looking at how a hitter controls the zone is subtracting their OSwing% from their ZSwing%. The wider the spread between the two numbers, the better. Here’s how Bryant has managed in this regard.
| Year | ZSwing% | OSwing% | Z-OSwing% |
|---|---|---|---|
| 2015 | 76.2% | 29.8% | 46.4% |
| 2016 | 74.2% | 30.8% | 43.4% |
Everything went the wrong way, yes, but Bryant also possessed decent control of the strike zone as evidenced by his 11.3% career walk rate, a number that we can surmise will improve based on aging curves. Let’s also give credit where credit is due: Bryant learned to lay off pitches in the dirt. In 2015, pitchers threw 101 pitches in the dirt to Bryant and he offered at 25 of them (24.8%). In 2016, pitchers went back to the dirt 106 times against Bryant, but he only offered at 16 of them (15.1%).


Bryant ended 14 plate appearances with a strikeout on an in-the-dirt pitch last year. Considering what we know about the run values of balls and strikes within the context of a plate appearance, identifying and not swinging at pitches below the zone is a valuable improvement. That improvement came at a cost. Bryant increased his OSwing% at pitches off the outside corner of the plate by 6.9%. In raw numbers, he swung at 13 more pitches in this area while seeing 34 fewer pitches in that spot. This is especially curious, given what we’ve established about his increased proclivity to pull the ball.
GB Exit Velocity
Sort the FanGraphs leaderboard for IFH% leaders over the past two seasons and you’ll find a lot of unsurprising names at the top. The top 5 includes Starling Marte, Kris Bryant, Odubel Herrera, Mike Trout, and Jose Altuve. Not to put down Bryant’s baserunning, but he’s the odd man out in this group.
We’ve already covered what a valuable baserunner Bryant has been, although speed and good baserunning don’t always go hand in hand. (Looking at you, Jose Altuve.) Bryant’s speed score over his first two seasons has been 5.1, which puts him in the company of Freddy Galvis and Jason Heyward, two guys with nice speed. Bryant’s professional season high in stolen bases is a respectable 15. He did it in 2014 (8 SB in AA and 7 SB in AAA) and again in 2015 (2 SB at AAA and 13 as a rookie). He possesses a long stride and is lean for a hitter with such prodigious power.
If I had access to defensive alignments, I would test my theory that infields play him like the slugger that he is—deeper. This would create longer throws for the infield and could also delay the infielders from closing in on slowly hit choppers, with both scenarios leading to more infield hits. This is only a theory at this point, however.
Given what data is available to the public, the best I can offer is a DIY home-to-first average time for Bryant on competitive plays. I used Baseball Savant’s search engine to find media for Bryant’s ground ball events that included singles and double plays in 2015 and 2016, sorted by distance. I sifted through the videos to find bang-bang plays at first and then timed each event 10 times. I came up with an average for each video and eventually an average for all the videos. I can promise you that the average time of 4.24 seconds that this exercise produced is not 100% accurate, but it’s in the ballpark and it’s the best we have. This number is above average but is propped up from some times I recorded from his rookie season and it’s possible that his speed is already in decline.
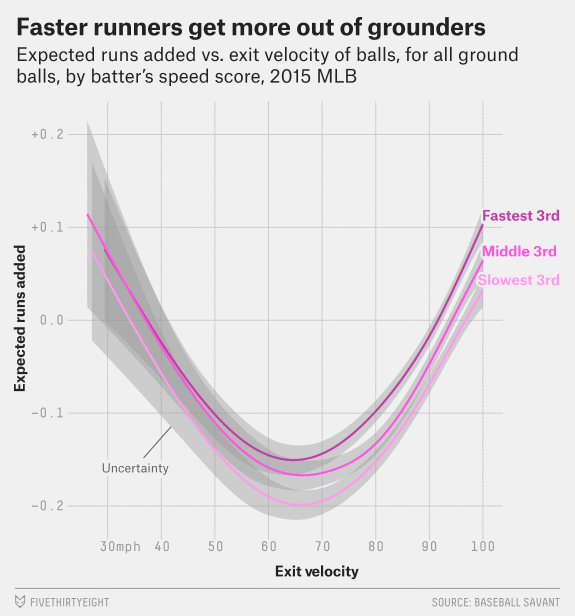
For what it’s worth, Bryant’s speed tool was given a current score of 50 by Kiley McDaniel in 2014 with a future grade of 45 (with 50 indicating average). While it’s true that speed correlates better with production on ground balls than exit velocity, Bryant’s speed will be in that below average (45) range before long. When that happens, the authority with which Bryant hits his ground balls will present a problem.
Bryant’s 83.2-mph average ground ball exit velocity in 2016 matched his figure from 2015. Both were a full standard deviation below the mean. Bryant’s BABIP on ground balls sits at .297 for his career. The league average BABIP on ground balls in in 2016 sat at .239. On ground balls hit between 83 and 84 mph, that number drops to .175. While we don’t have access to all the granular data, I think it’s reasonable to infer that he’s been the beneficiary of some lucky circumstances.
At this point, let’s clear our minds of the shoulder angel/shoulder devil; allow me to shoot it to you straight. This article (along with its predecessor) was supposed to be titled, “Let’s See How Far Kris Bryant’s Value Could Crater”, but I felt like I was grasping at straws after I realized the significance of his improved strikeout rate. An imagined, realistic, worst-case scenario for Bryant is based on a lot of BABIP conjecture and assumes some regression in overall athleticism. The problem is that he’s so adept at baserunning and fielding that he’d still provide above-average value. I worked out the projection and figured that Bryant bottoms out at 3.4 WAR. Here’s the full projection if you’re curious.
| AVG | OBP | SLG | HR | SB | wOBA | wRC+ | BsR | Def | WAR |
|---|---|---|---|---|---|---|---|---|---|
| 0.234 | 0.323 | 0.438 | 29 | 5 | 0.327 | 104 | 4.6 | 5.1 | 3.4 |
I hope some of you feel such a projection is viciously unfair, or that I was too tepid with regard to regression; I encourage and welcome your reactions. I believe it’s a hell of a floor and that’s great because, numbers aside, I think Kris Bryant cannot be underestimated. You see, Kris Bryant is like...Kris Bryant is like...
He’s like that one friend we all had growing up that was seemingly better than everyone at everything. That person excelled in the classroom, they were effortlessly superior in all athletics, and their romantic life was the stuff of adolescent legend. This was that kid who made you suspicious that your mom would be willing to trade you for them. It’s possible you caught on to subtle things you heard your mom say like, “Well how did Kris get an A on his test?” (You copied off him and you got a C); or “I bet Kris doesn’t talk to his mom like that” (He doesn’t); or “God, I wish Kris was my kid” (Not subtle). There’s a good chance that you were Kris Bryant for somebody, but as with all things, there’s a gradation of dominance, and you aren’t at the top—because you aren’t Kris Bryant.
If you are Kris Bryant, the former Rookie of the Year, and current World Series Champion and National League MVP, you might be blushing. You’re a pretty humble guy. I learned that after being named your high school’s salutatorian, you allowed a classmate to take the role when you found out she wanted it so badly.
Or you might be laughing. You do seem to have a good sense of humor. Remember when you pranked that junior college baseball team into thinking you were a European star joining their first-place team in the middle of the season and they were all freaked out about how much playing time they’d lose? Or how about the time you posed as a Lyft driver in Chicago and asked passengers about what they thought of the hype surrounding the Cubs young third baseman? Or even how you laugh when your teammates send you selfies of themselves with Express billboards on which your face is plastered?
Or maybe you are feeling just a little bit cocky. You’re 6’5”, 230 lbs. essentially the prototype for a baseball player. When that’s combined with boyish good looks and eyes that look as if they were unearthed on an expedition inside a Colombian emerald mine, then it’s simply unfair.
Or maybe you’re kind of annoyed by the assumptions people have about your adolescent romantic exploits – after all, you’re marrying the girl you’ve been dating since you were 16...
You know what, I wish my mom could have Kris Bryant for a kid, too.

Loading comments...