Hands up who hasn't heard of hit tracker? No, I didn't think there would be many.
In case you have been in baseball la-la land for the past 18 months let me refresh your memory. Hit Tracker is a web site run by Greg Rybarczyk, that is Ree-bar-chick for the phonetically challenged, I think!
Greg has built the mother of all spreadsheets that uses a variety of inputs to calculate the distance a home run travels. You may wonder why we'd want to do this but consider that no two round-trippers are ever the same: A wind-assisted long ball that flies over the fence at Coors Field may be caught on the warning track at ATT Park, especially if there is a strong inward gust off the bay. Greg tracks the landing point of every home run and based on altitude, wind direction, temperature, wind speed and myriad other variables he calculates the actual trajectory of the home run.
This also allows him to determine the normalized trajectory of the home run ignoring all the extraneous factors mentioned above. In other words we can compare home runs on an equal basis.
This is a baseball analyst's paradise and gives us a truck load of new data to play around with. Want to find out who, pound for pound, clubs the ball the furthest? Or which part of the yard your favourite slugger favors? Or whether a homer over the Green Monster in Fenway would have made ithad it been hit in Yankee stadium? Then check out hit tracker. That's enough bluster for the moment. If you didn't know I am a huge Braves fan, and what I want to do is have a look at the Braves' offensive prowess using hit tracker.
First let's turn our attention to the Braves'home yard, or The Ted as it is known to Atlantans.
Hit tracker tells us the following about the Ted in 2006:
- Number of HR: 195
- HR/game: 2.14
- Avg standard distance: 407.3 ft
- Avg true distance: 396.6
Interesting, I hope you agree! Your first question may be about the difference between true and standard distance. True distance is the length of ball flight in that park under current conditions. Standard distance is that length adjusted for a neutral park.
Take a look at the location of all homers in the Ted last year:
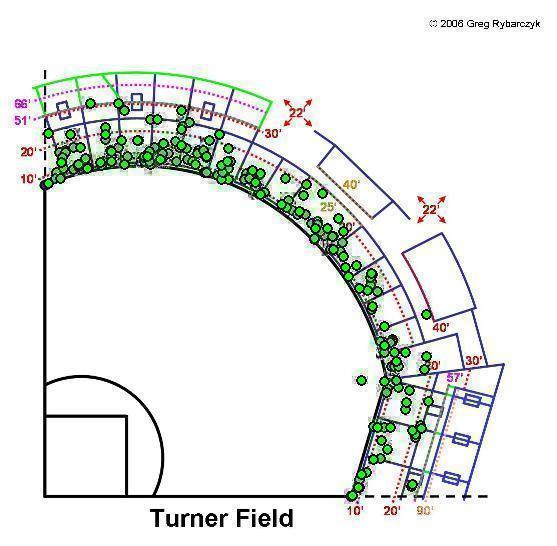
The distribution suggests more homers to left field but with more right handed batters in the bigs that isn't too surprising. Also with some of the Braves'power bats such as Andruw Jones and Francoeur favoring the left field long ball we should expect a slight bias in that direction.
So, who hit the longest home run at Turner Field last year?
Date      Hitter                True Distance
09/30/06  Berkman, Lance        472
04/30/06  Francoeur, Jeff       463
05/13/06  LeCroy, Matthew       454
05/18/06  Francoeur, Jeff       452
06/20/06  Glaus, Troy           451
06/20/06  Jones, Andruw         448
07/01/06  Jones, Chipper        448
09/27/06  Francoeur, Jeff       445
06/18/06  Ramirez, Manny        444
07/09/06  Dunn, Adam            443
05/18/06  Francoeur, Jeff       442
05/18/06  Abercrombie, Reggie   441
07/26/06  Borchard, Joe         441
07/09/06  Jones, Andruw         441
04/13/06  Francoeur, Jeff       440
And the winner is ... Lance Berkman of the Houston Astros with a 471ft torpedo; although that was against soft-tossing Lance Cormier, which helps of course.
What happens if we change tack and adjust for the extraneous factors?
Date      Hitter                Std Distance
05/18/06  Abercrombie, Reggie   469
05/18/06  Francoeur, Jeff       450
6/5/06    Francoeur, Jeff       447
04/30/06  Francoeur, Jeff       446
06/20/06  Jones, Andruw         445
8/12/06   Fielder, Prince       445
7/1/06    Jones, Chipper        444
05/18/06  Francoeur, Jeff       442
09/30/06  Berkman, Lance        436
06/20/06  Glaus, Troy           436
09/27/06  Francoeur, Jeff       436
04/13/06  Francoeur, Jeff       436
9/8/06    LaRoche, Adam         436
07/26/06  Borchard, Joe         435
Wow, that certainly paints a different picture. Although Reggie Abercrombie of the Marlins tops the pile it is clear from the rest of the list that Francoeur has plenty of pop. Take a look at the average standard distance of your favorite Braves hitters.
Hitter                Std Distance
Francoeur, Jeff       410.2
Renteria, Edgar       404.7
Davies, Kyle          404.0
Jones, Chipper        402.7
Diaz, Matt            402.3
LaRoche, Adam         400.6
Giles, Marcus         400.6
McCann, Brian         398.1
Not surprisingly this confirms our suspicions with Frenchy the clear distance champion. Number 2 and 3 maybe more of a surprise, well, superficially at least. Renteria doesn't hit many dingers and Davies is a pitcher. What are those two guys doing so high on this leader board?
Because these two don't hit many home runs they also hit less home run potential balls. In stats lingo their HR/OF will be lower because they will hit far more lazy pop-flys. When they ripsnort one over the fence you can be pretty sure they must have got A1 contact. Here are the HR/OF of the top six to prove my point.
Hitter                HR/OF
Francoeur, Jeff       17%
Renteria, Edgar       10%
Davies, Kyle          n/a
Jones, Chipper        19%
Diaz, Matt            10%
LaRoche, Adam         26%
Giles, Marcus         7%
McCann, Brian         14%
As we expect players with more consistent power have a much higher HR/OF rate. Renteria and Giles, for instance, see most fly balls caught whereas as LaRoche thumps 1 in 4 out of the yard!
For the remainder of this piece I want to take a brief look at four Braves players and see what their home run hit charts look like. The chosen four disciples are: Jeff Francoeur, Andruw Jones, Chipper Jones and the recently departed Adam LaRoche.
Andruw Jones
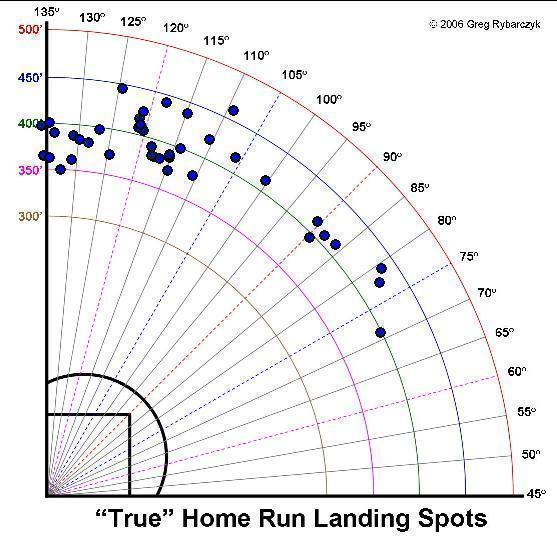
Andruw's home runs generally cluster to left field. He bats right handed and is a natural puller of the ball so this is what we'd expect to see. That he has hardly any opposite field home runs in the Ted is a surprise and is one the reasons his 2006 season was a shade less productive than his 2005 one.
Chipper Jones
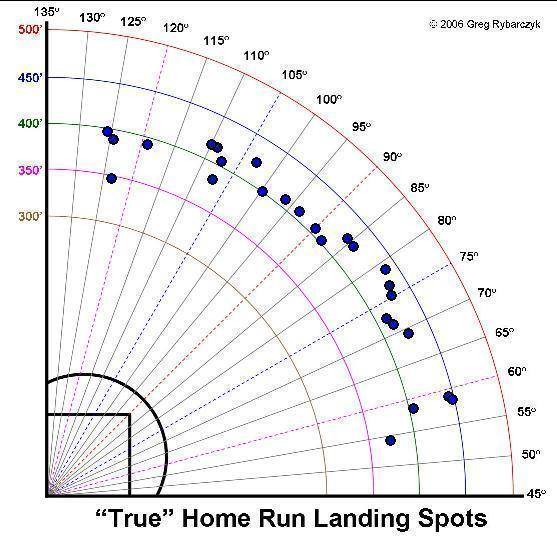
Chipper hit fewer home runs than Andruw did but his distribution is more equal. This probably shouldn't be too surprising as he is one of the finest switch hitters to ever have stepped on to the plate. This chart would support the assertion that he was, and still is, capable of spanking the ball anywhere in the park.
Jeff Francoeur
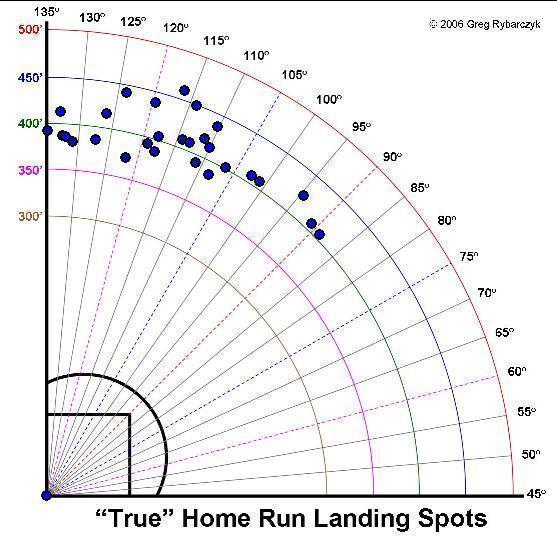
Talk about being consistent. Like Andruw Jones, Frenchy bats right-handed and pulls the ball -- so much so that all his yard-leavers have been to left field. If Jeffrey could learn to walk and hit opposite field home runs he'd potentially be the most awesome player in the bigs. Don't hold your breath though.
Adam LaRoche 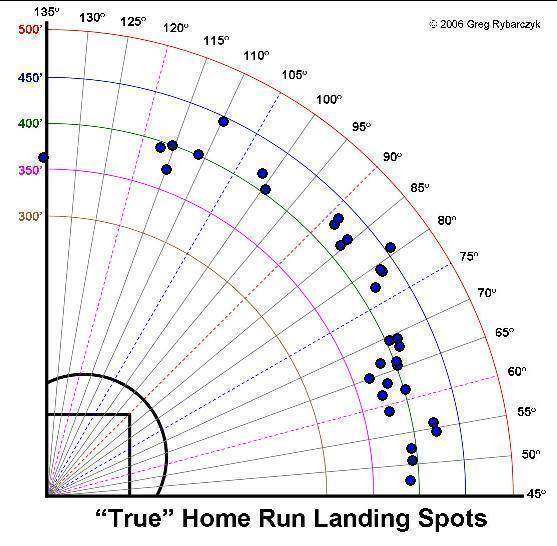
Adam is a lefty and his hit chart shows it. He mostly clubs the ball over the right field fence though he certainly has enough power to launch one to the opposite field. PNC Park has a shallower right field which should benefit LaRoche's southpaw pull tendencies. Look for him to do well for the Bucs next year.
So, can we conclude anything from all this? No, not a great deal actually. On an individual player level it is certainly interesting but 2006 was Hit Tracker's inaugural year so we can't even look at year-to-year tendencies. As we get more location that from this and other sources our capacity to run analysis and wheedle out insight will grow.
The next phase of baseball analytics will (in my opinion) be analyzing detailed hit location data. One of the reasons I am so excited about the great work that Greg is doing at Hit Tracker is that his site helps to bring that phase closer to reality. The universe of potential future applications is significant. For instance, Greg has already done some preliminary analysis on what the impact of different parks has on specific hitters (akin to getting under the skin of park factors) and is already thinking about extending his system to non-home run hit types.
Bring it on, Greg.
Loading comments...